

The Invisible Stack: What Actually Drives the Price at the Pump


By Bryan Kaus
Most people think gasoline prices are simple. They’re not.
They think one person or one decision moves the number on the pump. That’s almost never true.
I’ve spent my career in oil & gas, refining, chemicals, and logistics. I’ve worked pricing, commercial operations, sat through compliance reviews, and lived inside the P&L. The disconnect between what people believe and how the system actually works is enormous.
This is the explanation you can save, reference, and share when someone tells you gasoline prices are simple. Here’s how the system actually works.
What You’re Actually Paying For
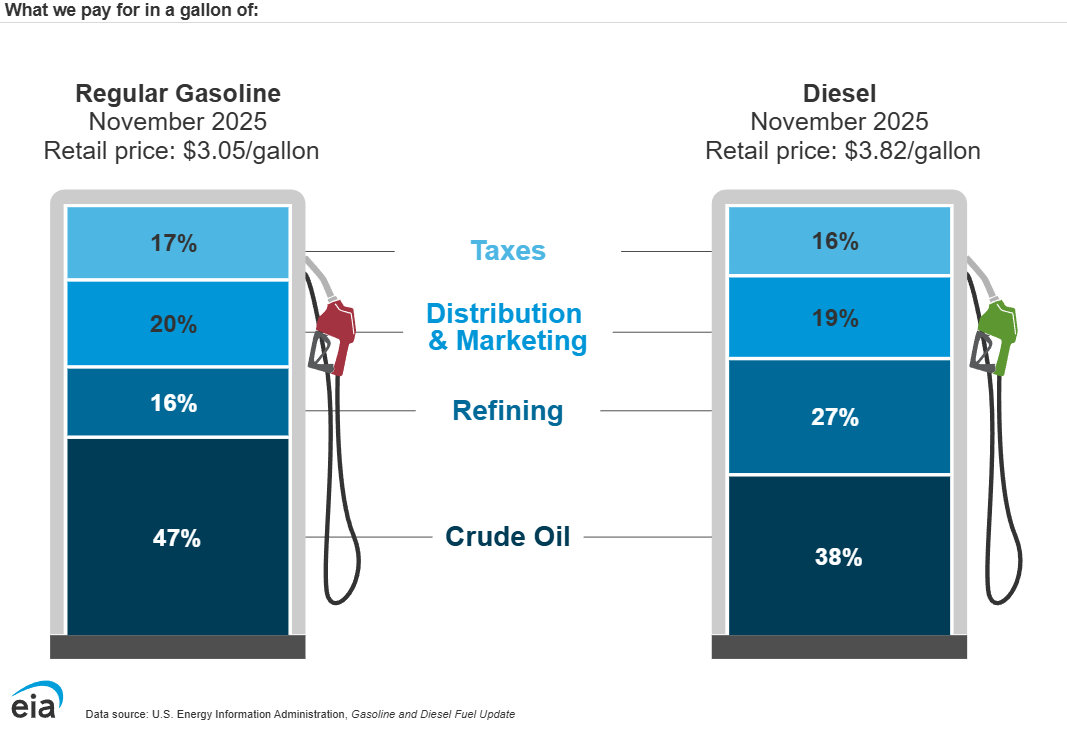
When you buy gasoline, you’re not buying one thing. You’re buying the output of a global commodity supply chain with four major cost components:
Crude oil — the raw input (typically 50-60% of the retail price)
Refining — turning crude into spec gasoline (15-25%)
Distribution & marketing — pipelines, terminals, trucks, retail (10-15%)
Taxes & compliance — federal/state/local taxes plus credit programs (10-20%)
Here’s the first reality most people miss: crude is globally priced. It moves on global supply/demand, OPEC+ decisions, geopolitical risk, inventory levels, and refinery demand. That’s why when WTI crude is trading around $59/barrel and Brent around $62/barrel (as of mid-January 2026), those benchmarks are being set by global markets—not domestic talking points.
For context: EIA’s national regular gasoline price was $2.779/gal for the week ending January 12, 2026. That number is the end result of the stack—not one input.
A Simple Worked Example
Let’s break down a $2.80/gallon pump price:
Crude oil: ~$1.50 (54%)
Refining: ~$0.60 (21%)
Distribution & marketing: ~$0.35 (13%)
Taxes & compliance: ~$0.35 (13%)
Note: These percentages shift with crude price movements, regional factors, and seasonal patterns. When crude spikes $10/barrel, that crude component can jump to 65-70% of the pump price. When crude falls, the other components become proportionally larger.
This is why crude is the big lever—and why “controlling” pump prices requires understanding global oil markets, not just domestic policy.
The Tax Layer: Visible, Verifiable, Misunderstood
Taxes are the easiest component to verify—and still one of the most misunderstood.
Federal gasoline excise tax: 18.4¢/gal (fixed since 1993). This funds the Highway Trust Fund - infrastructure you use every time you drive.
Then states add their own structure: excise taxes, fees, and depending on the state, sometimes sales tax or local assessments.
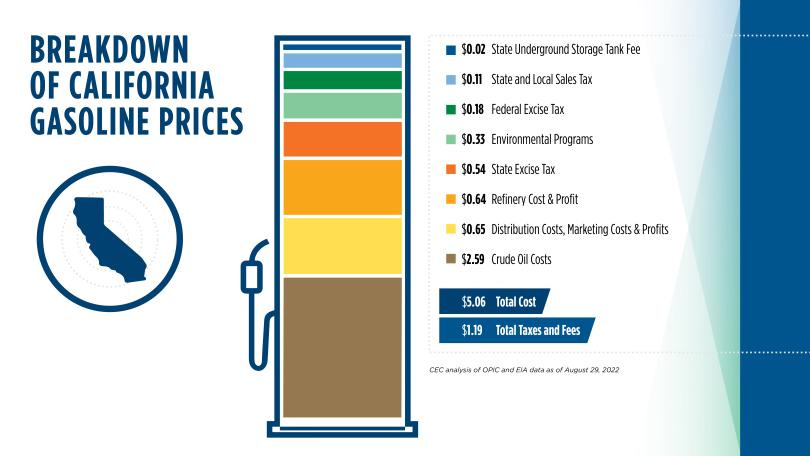
California: ~68¢/gal in state taxes
Pennsylvania: ~58¢/gal
Illinois: ~54¢/gal
Texas: ~20¢/gal
Missouri: ~17¢/gal
Alaska: ~9¢/gal
That’s a 59-cent spread between the highest and lowest state tax regimes before crude costs, refining margins, or logistics even enter the picture.
It’s not conspiracy. It’s federalism. The Tax Foundation maintains a clean state-by-state breakdown if you want to see the full variance.
Summer Blend: Real Chemistry, Real Costs
Every spring, people talk about “summer blend gasoline” like it’s a scam.
It’s not.
Gasoline volatility is measured by Reid Vapor Pressure (RVP)- how easily fuel evaporates. In warmer months, EPA regulations in many metro areas require lower RVP gasoline (typically 7.8 psi vs. 9.0+ psi in winter) to reduce evaporative emissions that contribute to ground-level ozone (smog).
Lower RVP specs mean:
Different blending requirements
Less operational flexibility
Tighter effective supply
Higher cost to produce compliant fuel (typically 5-15 cents/gallon more expensive)
This applies in Houston, Phoenix, Chicago, and Portland. Red state, blue state—doesn’t matter. It’s air quality chemistry.
So when prices tick up during the spring transition to summer-grade fuel, that’s not price gouging. That’s what tighter specifications look like in a system with limited slack.
The Compliance Costs Most Drivers Never See
Beyond taxes, there are two major compliance layers that add real costs—but most consumers don’t know they exist.
Federal: Renewable Fuel Standard (RFS)
The RFS requires obligated parties (refiners/importers) to blend renewable fuels or acquire compliance credits (RINs—Renewable Identification Numbers) to meet annual volume obligations. In 2024, the RVO required approximately 20.8 billion gallons of renewable fuel to be blended into the transportation fuel supply.
Whatever your view of biofuel policy, the business reality is straightforward: this is a managed cost that flows through blending economics, credit procurement, working capital allocation, and regulatory risk hedging. RIN prices can swing from $0.50 to over $2.00 per credit depending on market conditions—and those swings directly impact the cost structure.
State: Low Carbon Fuel Standards (CA, OR, WA)
California’s LCFS and similar programs in Oregon and Washington are market-based credit systems. Higher-carbon fuels generate deficits. Lower-carbon fuels generate credits. Credit prices are set by market supply/demand.
In California, LCFS credit prices have ranged from $50 to over $200 per metric ton of CO2-equivalent in recent years. When credit prices are high, that cost gets embedded in every gallon sold in the state.
These aren’t traditional “taxes,” but they function as priced inputs. When credit prices rise, compliance costs rise—and those costs get embedded in wholesale and retail pricing just like crude or freight costs do.
You don’t have to support or oppose the policy to understand the mechanism. This is standard cost pass-through in a commodity value chain.
Refining: Where Physics Meets P&L
Refineries don’t scale like software. They’re massive, capital-intensive industrial systems with:
Multi-year maintenance cycles
Unit-specific constraints and bottlenecks
Strict product specification requirements
Real operational and outage risk
U.S. refining capacity sits around 18 million barrels per day, and utilization typically runs 85-95% depending on season and market conditions. There’s not a lot of spare capacity sitting idle. When a major unit goes down unexpectedly, or a turnaround runs long, the market impact can be sharp—especially in regions with:
Limited refining capacity
Unique fuel specifications (boutique blends)
Constrained logistics infrastructure
Minimal import flexibility
This is why the West Coast often behaves like a “fuel island.” California has tighter specs and declining refining capacity. Over the past decade, the West Coast has lost significant refining infrastructure:
Phillips 66 ceased operations at its Los Angeles-area refinery and converted Rodeo to renewable fuels only
Chevron relocated its headquarters out of California
Valero has faced ongoing economic pressure on its Benicia facility
Shell sold its Martinez refinery (now operates under different ownership as Marathon Martinez)
HollyFrontier (now HF Sinclair) has rationalized operations
The region went from roughly 2 million barrels per day of refining capacity in the early 2010s to under 1.6 million barrels per day today—while fuel specifications got tighter and demand didn’t fall proportionally.
When there’s no cushion in the system, small disruptions create big price spikes. Not because of collusion—I’ve sat through those investigations, they always come up empty—but because tight markets with no slack behave exactly this way.
Distribution: Logistics Is Always a Price
Gasoline has to move through a physical supply chain:
Crude → Refinery → Pipeline → Terminal → Truck → Retail
Each link has costs:
Pipeline tariffs (typically $0.02-0.10/gallon depending on distance)
Terminal storage and handling fees ($0.02-0.05/gallon)
Truck freight rates ($0.05-0.15/gallon depending on distance and market conditions)
Retail operating margin ($0.10-0.25/gallon)
And each link has constraints. When pipelines run at capacity, terminals get congested, or truck availability tightens, local markets can diverge sharply from national averages.
That’s not manipulation. That’s logistics clearing at a price—exactly what commodity supply chains do.
Why “One Person Controls It” Is the Wrong Take
Here’s the reality of what can actually be influenced, and on what timeline:
Things policy can influence (slowly):
Long-cycle supply decisions (leasing, permitting—measured in years)
Federal tax policy (requires Congressional action)
Trade policy and sanctions (often with unintended second-order effects)
Limited emergency waivers (rare, situational)
Things that cannot be “dialed” short-term:
Global crude pricing (set by world markets of ~100 million barrels/day)
Refinery utilization and unplanned outages
Seasonal specification transitions
Regional logistics constraints
State and local tax structures
Weather and natural disaster impacts
So when someone tries to take credit for falling prices or assign blame for rising ones based on short-term moves, you’re watching narrative construction—not economic mechanics.
The Counterintuitive Signal: Cheaper Isn’t Always “Better”
Here’s what makes this tricky: falling pump prices can be genuine household relief while simultaneously signaling economic cooling.
Lower prices often reflect:
Softer global demand
Building crude inventories
Reduced freight and manufacturing activity
Fading geopolitical risk premiums
That’s why treating price as a simple “good/bad” signal misses half the story. Price is the output of supply and demand. When demand weakens, prices fall- even if supply hasn’t changed.
Right now (January 2026), we’re seeing:
WTI crude around $59/barrel
Brent around $62/barrel
U.S. rig count at 544, down from 584 a year ago (Baker Hughes)
Compressed refining margins
Soft global chemicals and materials demand
That last point matters. Chemicals demand is often a leading indicator. When petrochemicals soften globally, it usually means manufacturing, construction, and consumer goods production are slowing.
So yes—enjoy relief at the pump. But understand what’s underneath.
Why “Drill, Baby, Drill” Doesn’t Work Like People Think
Rig counts respond to economics, not slogans.
Operators drill when expected returns exceed the cost of capital. According to Dallas Fed surveys, operators need roughly $65/barrel WTI on average (with regional variation) to profitably drill a new well.
When crude trades sustainably below that threshold, capital discipline kicks in. Rigs get stacked. Projects get deferred. Employment contracts.
And even when new acreage opens or permits get approved, the timeline is real. Exploration → appraisal → development → production can take years. Sometimes a decade or more for complex plays.
Context matters here: U.S. crude production averaged around 13 million barrels per day in 2024. Even a 10% increase in domestic production (1.3 million barrels/day) gets absorbed into global markets of ~100 million barrels/day total demand. That’s meaningful, but not a game-changer for prices when OPEC+ can swing 3-5 million barrels/day with production decisions.
Oil and gas operates on geological time, not news-cycle time.
The Value Chain Reality
Here’s what people miss when they oversimplify this into heroes and villains:
Every part of this value chain has to work—and work well—for the system to deliver efficiently.
Underinvest in exploration? Supply shocks.
Underinvest in refining? Regional price spikes when units fail.
Underinvest in logistics? Market dislocations.
Overburden with poorly designed regulation? System fragility and volatility.
The companies that succeed in this space are the ones that:
Optimize across the full value chain
Maintain rigorous capital discipline
Build operational resilience into their systems
Navigate regulatory complexity without breaking stride
Understand that sustainable margin comes from execution, not hope
That’s the strategic reality most headlines miss entirely. This isn’t about good guys and bad guys. It’s about systems, trade-offs, risk management, and the economics of capital-intensive commodity businesses.
What to Watch (If You Want to Understand What’s Actually Happening)
If you want to read energy markets like an adult, track these instead of headlines:
Crude benchmarks (WTI, Brent) — your primary global supply/demand signal
Refinery utilization rates — especially regional tightness
Rig counts and E&P capex — what operators are actually doing with capital
Crack spreads (refining margins) — where value is being captured in the chain
Global chemicals demand — often a leading indicator for broader industrial activity
Policy and compliance changes — RFS adjustments, LCFS credit prices, state tax changes
And remember: lower pump prices can be consumer relief and an economic warning signal at the same time. Two things can be true.
The Point Taken:
Gasoline prices are a stack, not a headline.
Crude is the biggest driver - and crude is global (even with domestic production).
Refining, logistics, taxes, and compliance all matter—but they matter differently and on different timescales.
The system is complex. The trade-offs are real. And the only way to make sense of it is to stop looking for simple stories and start understanding it as the global commodity supply chain it actually is.
For strategic planners, investors, and operators: If you’re trying to navigate energy markets, optimize value chains, or build resilience in commodity-exposed businesses, the fundamentals don’t change. Discipline wins. Execution wins. Understanding the full stack wins.